
FIGURE 1.
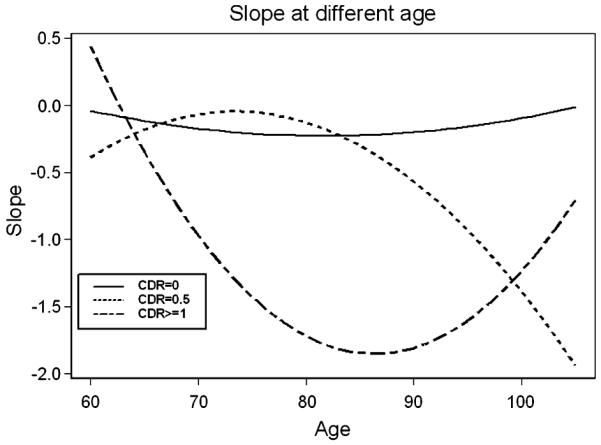
Slope at different age. The x-axis refers to age whereas the y-axis refers to rate of cognitive decline and not to extent of decline (in Mini Mental State Examination points). Thus values that are closer to 0 represent slower rate of decline. CDR indicates Clinical Dementia Rating.