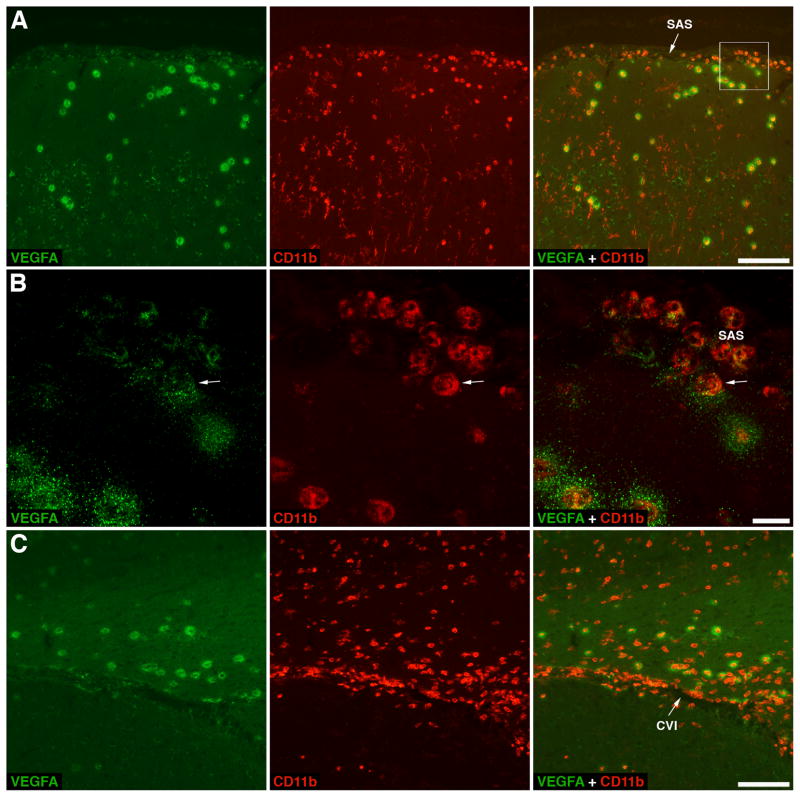
Figure 3.
Migration of neutrophils across pial microvessels in a rat model of traumatic brain injury (TBI). Upon invasion of traumatized brain parenchyma, neutrophils release vascular endothelial growth factor A (VEGFA). The VEGFA-immunoreactive product appears as haloes surrounding neutrophils, which likely represent the growth factor sequestered within the extracellular matrix due to the VEGFA binding to heparan sulfate proteoglycans. A The cerebral cortex adjacent to the post-traumatic lesion at 8 hours post-TBI. Double immunostaining with anti-VEGFA antibody and an antibody to CD11b, a subunit of integrin receptor expressed on neutrophils, monocytes/macrophages, and microglia, is shown. Note that neutrophils not only invade the traumatized cortex after crossing the blood-brain barrier (BBB) in brain parenchymal microvessels, but also accumulate in the subarachnoid space (SAS) after crossing the BBB in pial microvessels. B A higher magnification view of selected area from panel A. This confocal microscopy image shows neutrophils accumulating in the SAS, from where these inflammatory cells appear to invade the brain parenchyma. An arrow points at a neutrophil that is in the initial stage of crossing the pial/glial lining of the cerebral cortex and starts releasing VEGFA. Note that other neutrophils accumulating in the SAS that are located further from the cortical surface clearly carry preformed VEGFA, but do not release it. C A coronal brain section cut at the level of the hippocampus and stained with anti-VEGFA and anti-CD11b antibodies. The rat was sacrificed at 24 hours after TBI. Similar to their accumulation in the SAS, neutrophils enter the cistern of velum interpositum (CVI), a slit-shaped space above the third ventricle with highly vascularized pia mater, from where these leukocytes also appear to invade the injured brain parenchyma. Scale bars: panels A, C, 100 μm; panel B, 10 μm. Reprinted with permission from [77].

