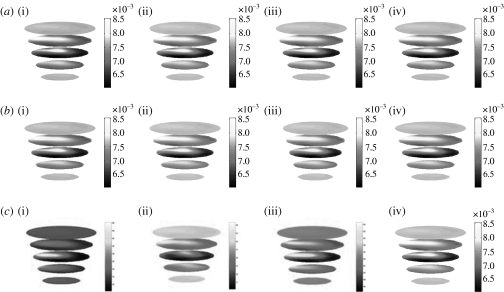
Figure 2.
Reconstructed images of (a) absorption and (b) reduced scattering at each wavelength from measured volunteer data: (i) 761 nm, (ii) 785 nm, (iii) 808 nm, (iv) 826 nm. (c) Calculated maps of blood content: (i) Hb, (ii) HbO2, (iii) HbT, (iv) S tO2. Each slice represents a plane through the mesh, from the bottom near the nipple to the top near the chest. The images are coronal views of the cross section through the breast at the 10th iteration at the wavelengths indicated.

