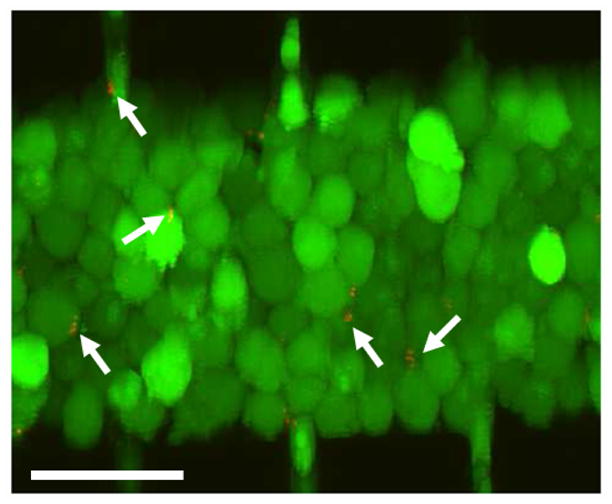
Figure 2.

Stacked optical slices showing distributions of B16.F10 and E. coli cells immediately after they were loaded into the microchannel. The tumor cells were stained with calcein-AM (green) and mCherry-expressing E. coli cells were red (arrows). Scale bar = 50 μm.
