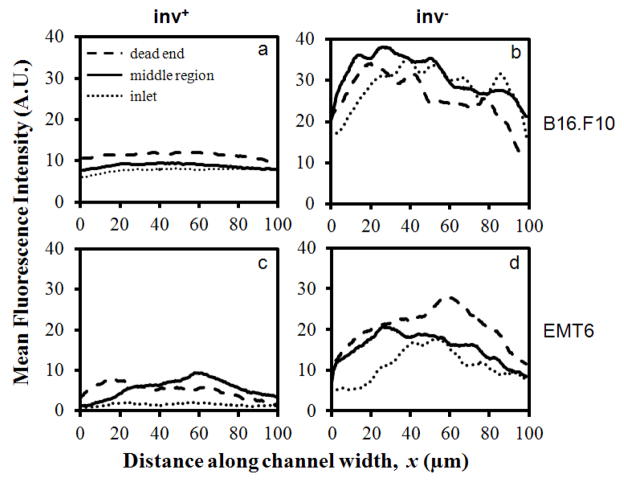
Figure 5.
Typical mean fluorescence intensity profiles of mCherry-expressing E. coli after 12-hr co-incubation with B16.F10 (a, b) and EMT6 (c, d) cells in microchannels. Bacteria were either non-invasin-expressing (inv−) or invasin-expressing (inv+). Individual curves represent fluorescence profiles at the dead end, the middle portion, and the inlet of the central channel.

