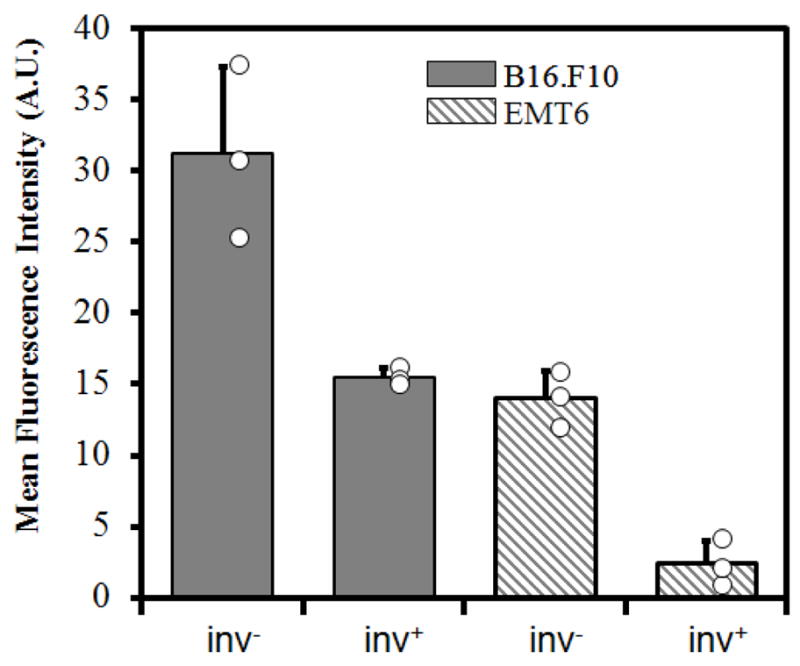
Figure 6.

Average fluorescence intensities. The intensity profiles shown in Figure 5 were averaged to obtain the mean fluorescence intensity of each channel. The open circles represent the intensities of individual samples, and the bars and the error bars represent means and standard deviations over three trials, respectively.
