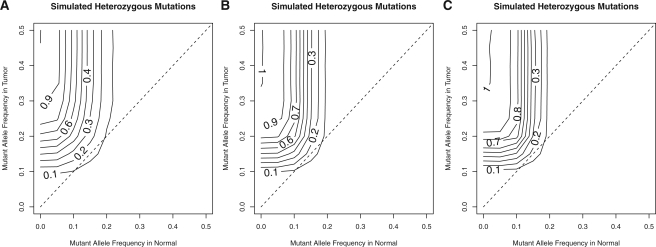
Fig. 1.
Simulations of power across various variant allele frequencies and across different depths in both samples: 30 reads (A), 60 reads (B) and 90 reads (C). Contours indicate the power for each combination of variant allele frequencies. The dashed line indicates simulations where the allele frequencies in tumor and normal are equal and thus, the contours intersecting this line indicate the expected FDR for those allele frequencies.

