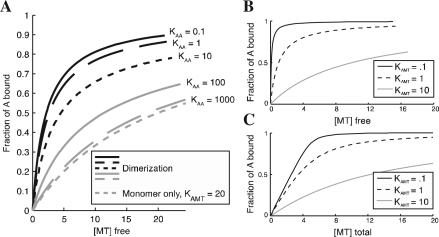
Fig. 1.
(A) Curves demonstrating the effect of dimerization on MT binding behavior. For all curves, the total amount of A is 10 μM, the dissociation constant for monomer binding to MT is 20 μM, and the dissociation constant for dimer binding to MT is 2 μM. The monomer-only curve is calculated using the first-order model with a dissociation constant of 20 μM. (B) Illustration of simple first-order binding behavior at different Kd values, with [A] total of 5 μM. (C) Curves for systems identical to those in (B), showing the effect of plotting binding as a function of [total ligand] instead of [free ligand] as in (B). Examination of the curves shows that the difference between (B) and (C) becomes significant when [A] > Kd. All graphs were made in MTBindingSim and edited in Adobe Illustrator.

