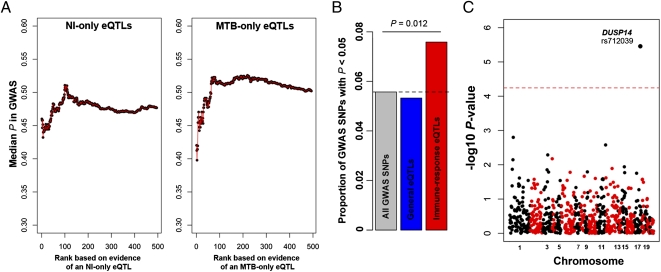
Fig. 4.
MTB-response eQTL are strong candidates to impact susceptibility to pulmonary TB. (A) The median GWAS P value for an expanding window of genes is plotted. We used the GWAS P values obtained when combining the Ghana and Gambia cohorts (16). Genes are ordered by the strength of evidence supporting an association with an eQTL only in the untreated (Left) or the infected (Right) DCs, respectively. To avoid positional biases, we restricted our analyses to the set of cis-SNPs that was tested in our study (i.e., SNPs located in 200-kb window centered on the TSS of proximal genes). (B) Histogram of the proportion of GWAS SNPs with nominal P values <0.05 among all GWAS SNPs (gray), among SNPs that were classified as eQTL in both untreated and infected DCs (blue), and among response eQTL (red). (C) Manhattan plot showing the negative log10 transformed P values (y axis) for the association between the response eQTL identified in this study and susceptibility to pulmonary TB. The dashed line corresponds to the genome-wide significance cutoff after a conservative Bonferroni correction.

