Fig. 4.
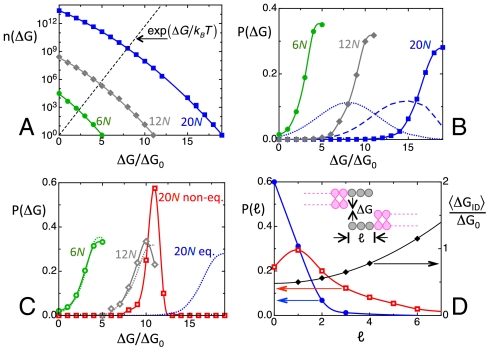
Calculated equilibrium and nonequilibrium distributions for ranDNA. (A) Number n(ΔG) of duplexes differing in sequences or in shift that can be formed within the ensemble of fully random sequences of a given length as a function of the pairing free energy ΔG. Blue squares—20N; gray diamonds—12N; green dots—6N. The n(ΔG) are normalized to n(ΔG) = 1 for the largest energy for each given oligomer length. Black dashed line—ΔG dependence of the Boltzmann factor, on the same scale. Free energy is expressed in units of ΔG0. (B) Equilibrium distribution P(ΔG) of the intraduplex binding free energy in fully random ranDNA at T = 25 °C. Blue squares—20N. Gray diamonds—12N. Green dots—6N. Dashed and dotted blue lines—P(ΔG) for 20N at T = 45 °C and T = 60 °C, respectively. (C) Free energy distribution P(ΔG) calculated through kinetic evolution on the basis of duplex lifetime and random collisions. Red squares—20N. Gray diamonds—12N. Green dots—6N. Dotted lines repeat, for comparison, the equilibrium distributions in B. Whereas 6N and 12N are at equilibrium or nearly so, the distribution of 20N is kinetically arrested and far from equilibrium. (D) Left axis: Calculated overhang length distributions P(ℓ) for 20N. Blue dots—equilibrium distribution. Red open squares—kinetically arrested distribution, on the same scale. Right axis: black diamonds—mean interduplex interaction free energy, calculated as the average value of the binding free energy resulting from collisions of random overhangs.

