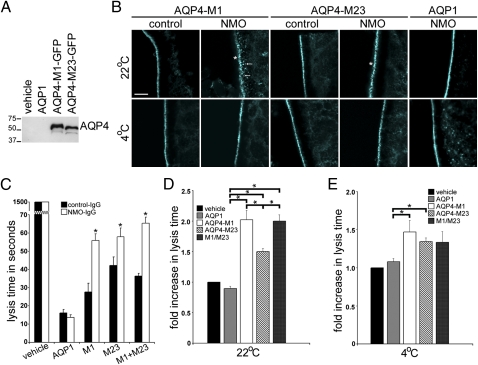
Fig. 5.
NMO-IgG binding inhibits water influx through AQP4. (A) Western blot analysis shows relative levels of AQP4 protein in cRNA-injected oocytes. Each lane represents lysates from approximately four oocytes. (B) Immunofluorescence staining of M1, M23, and AQP1 in plasma membranes of cRNA-injected oocytes exposed to control-IgG or NMO-IgG. At 4 °C, regardless of human IgG, and at 22 °C with control human IgG, all AQP immunoreactivities are tightly confined to the plasma membrane. At 22 °C with NMO-IgG, AQP1 is unchanged, but AQP4 M1 and M23 immunoreactivities are more punctate (asterisks), and M1 is visibly associated with subplasmalemmal vesicles (arrows). (Scale bar, 10 μm, pertains to all panels.) (C) Representative hypotonic stress assay (immersion in distilled water) shows oocyte lysis times (seconds) after exposure to control-IgG or NMO-IgG for 4 h at 22 °C. Each condition included 5–12 injected oocytes. Injected cRNAs are indicated below the graph. Asterisks indicate significance in comparing oocytes exposed to control-IgG and NMO-IgG for M1 (P < 0.001), M23 (P = 0.005), and M1 + M23 (P < 0.001). (D and E) Cumulative data from five to six hypotonic stress assays show fold increase in lysis times for oocytes exposed to NMO-IgG relative to lysis times for oocytes exposed to control-IgG at 22 °C or 4 °C. (D) Asterisks indicate P values relative to AQP1 controls: M1 (P < 0.001), M23 (P < 0.001), M1 + M23 (P < 0.001), and relative to M23—M1 (P = 0.032) and M1 + M23 (P = 0.016). (E) Comparisons are relative to AQP1: M1 (P = 0.028) and M23 (P = 0.001); differences between M1 and M23 were not significant.

