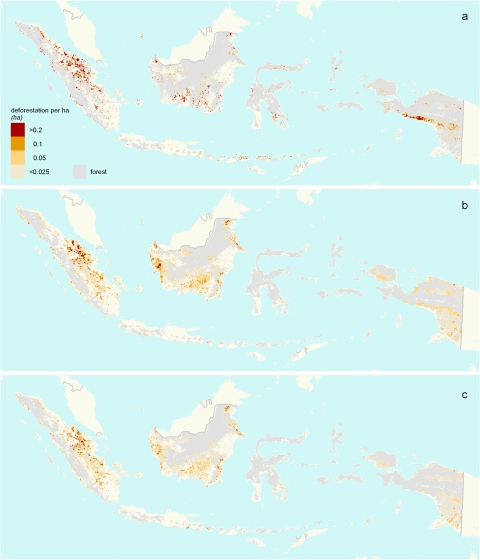
Fig. 1.
Deforestation in Indonesia, 2000–2005. (A) observed deforestation (687 kha/y; 860 mtCO2e/y); (B) modeled expected deforestation without REDD+ (691 kha/y; 809 mtCO2e/y); (C) expected deforestation with “improved voluntary incentive structure” for REDD+ (597 kha/y; 633 mtCO2e/y). Results are outputs of OSIRIS-Indonesia v1.5 assuming the following parameters: carbon price = $10/tCO2e; “effective” price elasticity = 3.8; exogenous agricultural price increase = 0%; peat emission factor = 1,474 tCO2e/ha; social preference for agricultural revenue relative to carbon revenue = 1.0; start-up and transaction costs = $0.

