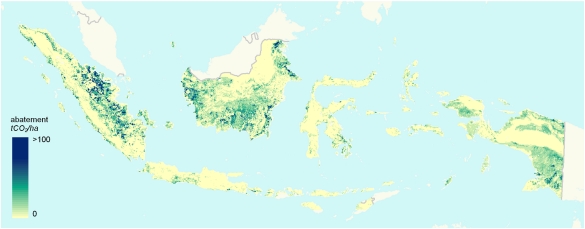
Fig. 2.
Expected spatial distribution of abatement under REDD+, Indonesia 2000–2005. Expected abatement provided in response to a price of $10 tCO2e paid for voluntary site-level emission reductions below business-as-usual levels. Darker blue represents greater voluntary abatement of emissions from deforestation in response to incentive payments. Expected abatement is greatest where deforestation emissions would be high in the absence of REDD+ but low in the presence of REDD+. Results are outputs of OSIRIS-Indonesia v1.5 assuming the following parameters: carbon price = $10/tCO2e; “effective” price elasticity = 0.0 (no leakage); exogenous agricultural price increase = 0%; peat emission factor = 1,474 tCO2e/ha; social preference for agricultural revenue relative to carbon revenue = 1.0; start-up and transaction costs = $0; site-level accounting; national government share of revenue = 0%; national government share of responsibility for costs = 100%.

