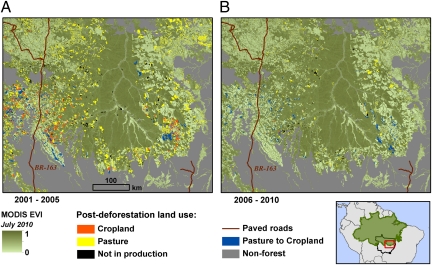
Fig. 2.
(A and B, enlargements of the area boxed in red) Postdeforestation land uses in a subset of the study region from 2001 to 2005 (A) and 2006 to 2010 (B). Deforestation areas >25 ha were derived from the PRODES dataset (11), and land use from analysis of the MODIS EVI time series. The Brazilian Amazon forest biome is shaded in green (Lower Right).

