Fig. 2.
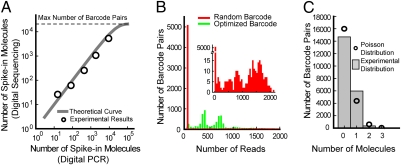
Spike-in sequence quantification. (A) Correlation between the number of spike-in molecules for five different spike-in sequences as measured by digital PCR and digital counting of unique barcodes. The theoretical curve, which saturates because of the finite number of barcode pairs (21,025), is calculated based on the Poisson distribution (18). (B) Histograms of the number of reads corresponding to each observed barcode attached to the most abundant spike-in sequence for two experiments. The red histogram corresponds to a spike-in sequence labeled with random barcode sequences, and the green histogram corresponds to a spike-in sequence labeled with our optimized barcodes. Note the left-most bin in the red histogram is >10-times larger than that of the green histogram and contains a large number of unique barcodes with a low number of reads. This discrepancy is caused by various sequencing and PCR amplification errors, which generate new artifactual unique barcodes not present in the original sample and result in a large number of falsely identified unique barcodes (SI Materials and Methods). (Inset) The red histogram in greater detail. (C) Histogram of the number of times a barcode pair was observed with all five spike-in sequences (i.e., the number of spike-in molecules attached to a given barcode pair). Because the spike-in sequences sample the barcode pairs randomly with very little bias, the histogram follows a Poisson distribution.

