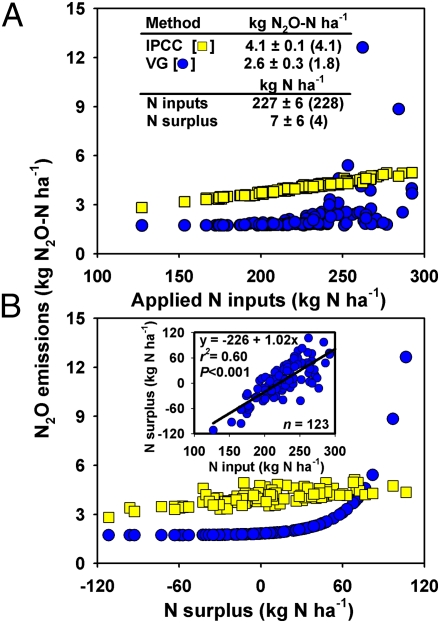
Fig. 1.
Soil N2O emissions of irrigated maize plotted against applied nitrogen (N) inputs (A) and N surplus (B). N2O emissions were estimated by following IPCC N-input [□ (23)] or van Groenigen et al. N-surplus approach (VG; •; ref. 24). Average (±SE) N2O emissions, N inputs, and N surplus (medians in parenthesis) are shown. B Inset shows the relationship between N surplus and applied N inputs.

