
Figure 3.
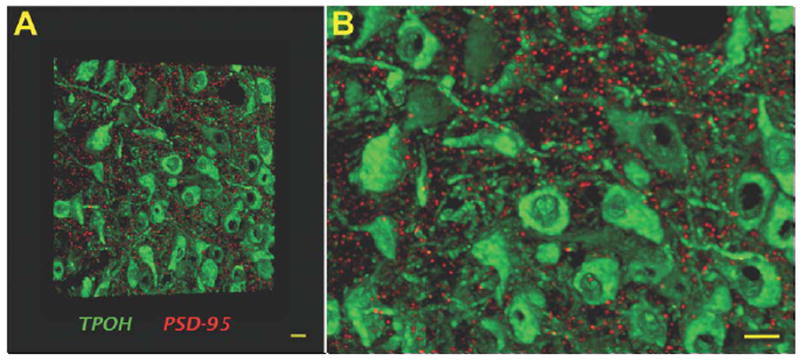
Volumetric image of labeling for TPOH and PSD-95 in the mouse DR, illustrating the high-resolution achieved in array tomography. A: A volume rendering of 30 ultrathin (70 nm) serial sections showing a high density of TPOH-positive cells (green) abundantly surrounded by discrete PSD-95 puncta (red). B: Zoomed-in view of (A) indicating the absence of out of focus light resulting in high-resolution images amenable to quantitative analysis. Scale bars = 10 μm. [Color figure can be viewed in the online issue, which is available at wileyonlinelibrary.com.]