
Figure 5.
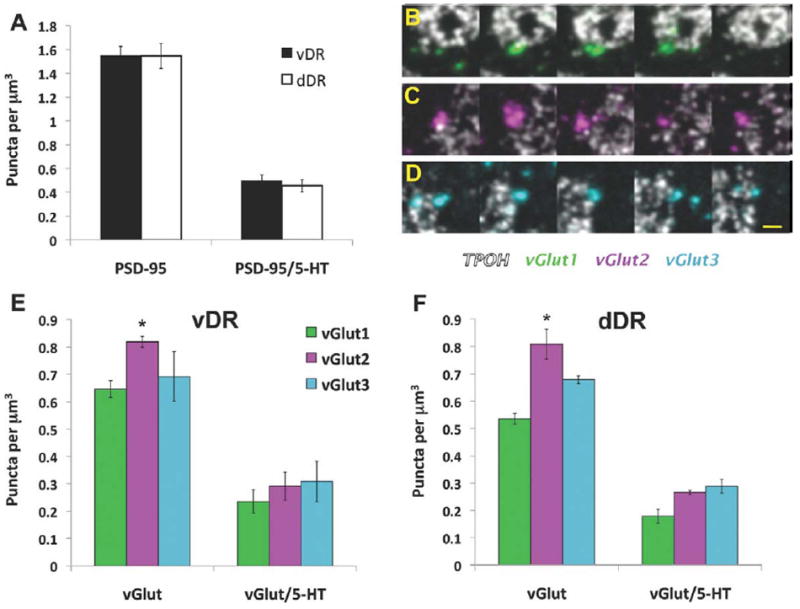
Quantitative analysis of PSD-95 and VGLUT puncta in the mouse DR. A: Density of PSD-95 puncta, and their association with 5-HT cells in the ventral (vDR) and dorsal (dDR) parts of the DR. B–D: Serial section images through individual VGLUT1 (green), VGLUT2 (magenta), and VGLUT3 (light blue) puncta, respectively, in association with 5-HT cells (white). E,F: Density of VGLUT puncta and their associations with 5-HT cells in the vDR and dDR, respectively. *P < 0.002 vs. VGLUT1. Scale bar = 2 μm in D (applies to B,C). [Color figure can be viewed in the online issue, which is available at wileyonlinelibrary.com.]