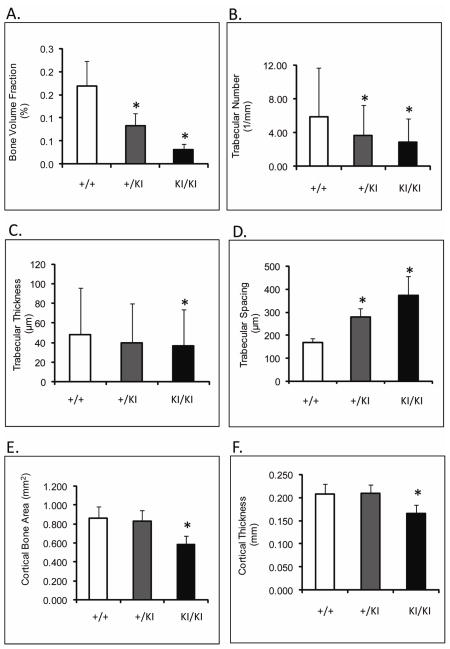
Fig. 4.
μ-CT analysis of femoral microstructure at 10 weeks of age. A) Bone volume fraction; B) Trabecular number; C)Trabecular thickness; D) Trabecular spacing; E) Cortical bone surface area; F) Cortical thickness. Trabecular and cortical bone measurements are significantly reduced in Sh3bp2+/KI and Sh3bp2KI/KI mice as compared to Sh3bp2+I/+ mice.

