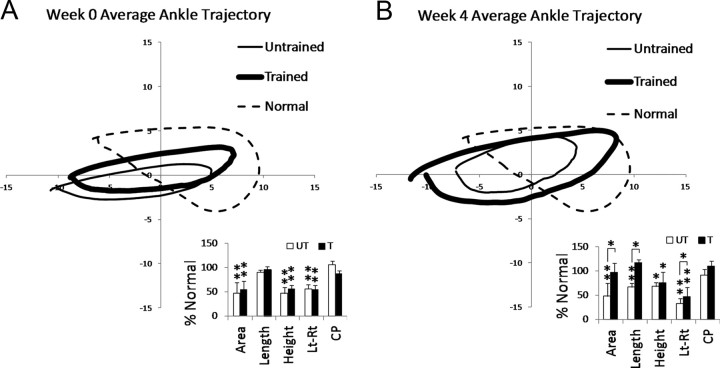
Figure 5.
Average ankle trajectories during hindlimb treadmill stepping in Normal and ST rats. A, B, The average trajectory of the ankle for the Untrained (thin line) and Trained (thick line) ST rats is shown for Week 0 (A) and Week 4 (B), respectively. Normal ankle trajectory is also shown (dashed line). The average trajectory for each group was calculated from 11 Untrained, 11 Trained, and 9 Normal rats (during 30 s of stepping at 85% weight support for each rat). Bar plots comparing kinematic characteristics between Untrained (UT, white) and Trained (T, black) are shown. Averages are shown (n = 11 Untrained; n = 11 Trained) and are expressed as a percentage of Normal values (100%). Area, Length, and Height of step cycle trajectory are shown. Lt-Rt is a measure of the alternating movements between the left (Lt) and right (Rt) hindlimbs. CP is cycle period. The asterisks ** and * indicate significant difference from Normal at the p < 0.01 and p < 0.05 levels, respectively. Significant differences between Untrained and Trained groups are indicated by the lines and asterisks (*) above the bars (p < 0.05).

