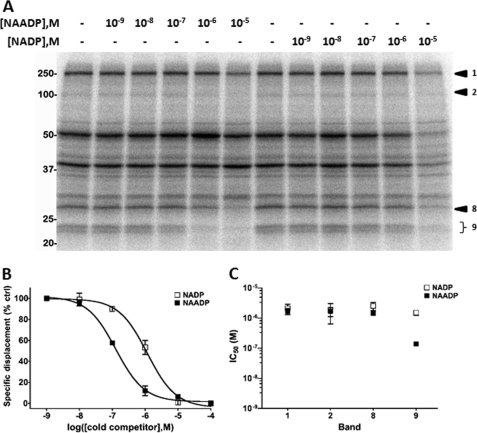
FIGURE 3.
NADP and NAADP protection of PAL in SKBR3 whole cell lysates. A, representative PAL image showing effects of increasing concentrations of NAADP (lanes 2–6) and NADP (lanes 8–12) on PAL. Candidate bands 1, 2, 8, and 9 are marked. M, molarity. B, densitometry of the 22/23-kDa doublet (band 9, n = 4) from A in the presence of NADP (open square) and NAADP (solid square). % ctrl, percentage of control. C, comparison of half-maximal inhibitory concentrations (IC50) for NADP (open) and NAADP (solid) for bands 1, 2, 8, and 9 in SKBR3 WCL (n = 4).

