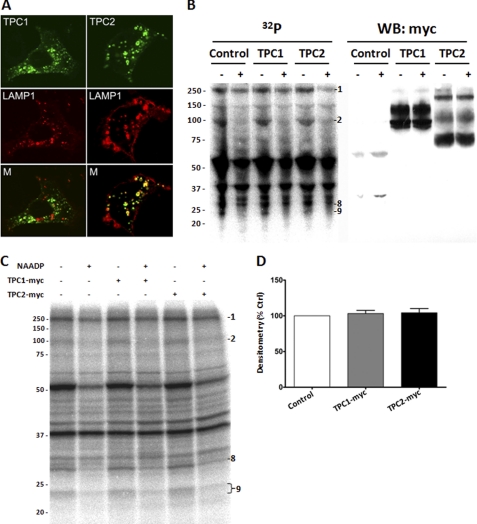
FIGURE 6.
Lack of effect of overexpressed TPC isoforms on PAL profiles. A, images of SKBR3 cells transfected with TPC1-GFP (upper left) or TPC2-GFP (upper right) and in live cells co-expressing LAMP1-RFP (middle panel). Bottom, merged images for GFP and RFP. B, combined PAL/Western blot, allowing comparison of PAL reactivity (left) with immunological detection of TPC isoforms (right) on the same nitrocellulose membrane. Control cells were transfected with a Myc-GFP construct. WB, Western blot. C, representative PAL gel comparing reactivity in control WCL (transfected with Myc-ER) with TPC1-Myc (middle two lanes) and TPC2-Myc (right two lanes) transfected cells. Overexpression of TPC isoforms did not impact the PAL labeling profile in the absence or presence of NAADP. D, quantification of levels of the 22/23-kDa doublet in TPC1-Myc and TPC2-Myc transfected SKBR3 cells relative to controls (n = 4 independent transfections). % Ctrl, percentage of control.

