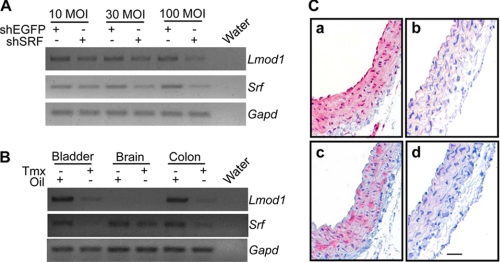
FIGURE 6.
LMOD1 expression in SRF-deficient cells and tissues. RT-PCR analysis of Lmod1 and Srf mRNA either in PAC-1 SMC transduced with shEGFP or shSRF for 72 h (A) or indicated tissues from adult mice carrying homofloxed Srf alleles and the tamoxifen (Tmx)-inducible Myh11-Cre driver (34) (B). Note the reduction in both Srf and Lmod1 mRNA in tissues derived from mice treated with Tmx (to activate Cre recombinase and effect excision of the Srf gene) versus the vehicle control (Oil). The latter results were extended by comparing protein expression of SRF (C, panels a and b) versus LMOD1 (C, panels c and d) in similar mice treated either with Tmx (C, panels b and d) or sunflower oil (C, panels a and c). The bar in panel d of C is 30 μm for all panels. The images in A and B were inverted in Adobe Photoshop so as to better indicate the bands in each gel.

