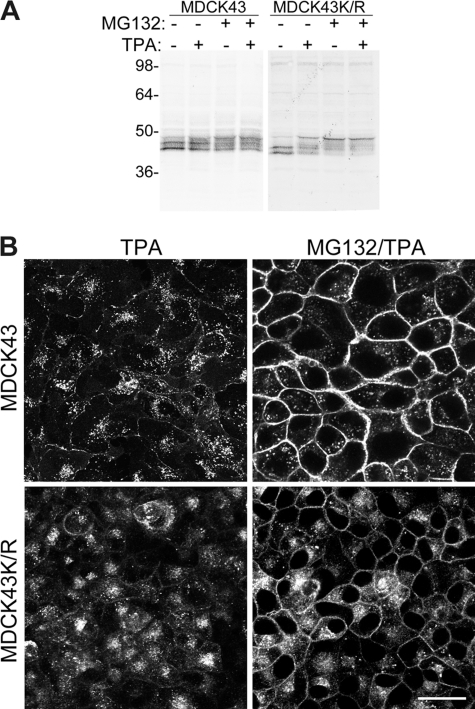
FIGURE 3.
Cx43 in MDCK43 and MDCK43K/R cells treated with TPA and MG132. A, representative immunoblot for Cx43 in cells treated with TPA (1 h) or MG132 (30 min) followed by TPA addition (1 h). Similar banding patterns were observed in four independent experiments. Positions of prestained standards of the designated molecular mass in kDa are indicated on the left. B, immunofluorescence microscopy for Cx43 in cells treated with TPA or MG132 followed by TPA. Scale bar, 25 μm.

