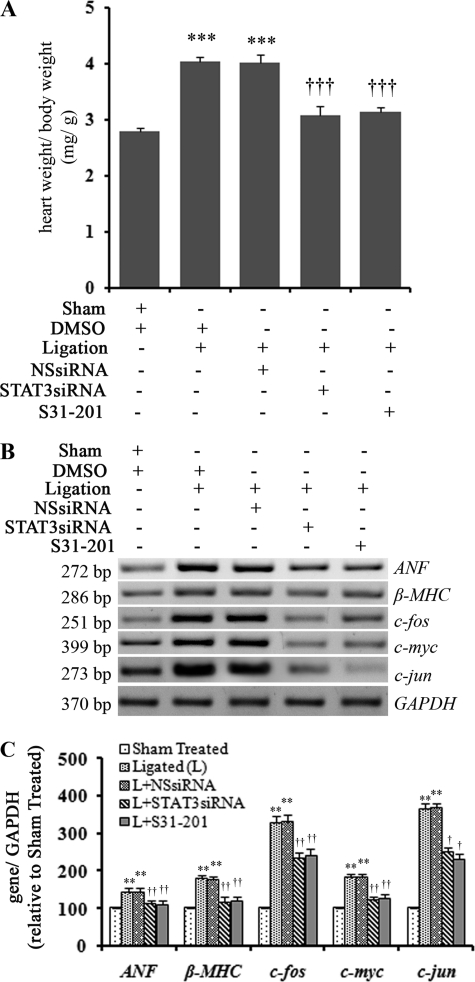
FIGURE 5.
In vivo STAT3 inhibition resulted in regression of cardiac hypertrophy. A, the graph shows a significant decrease in HW to BW ratio of STAT3 siRNA (3.07 ± 0.21) as well as S31-201-treated (14 days) ligated animals (3.15 ± 0.077) compared to only ligated animals (4.03 ± 0.098). ***, p < 0.001 with respect to Sham-treated; †††, p < 0.01 with respect to ligation or ligation+NSsiRNA treatment; n = 10 in each group. B, RT-PCR results show both STAT3 siRNA (fourth lane, ligation+STAT3siRNA) and S31-201(fifth lane, ligation+S31-201) treatment (14 days), resulting in significant down-regulation of hypertrophy marker genes (ANF and β-MHC) and proto-oncogenes (c-jun, c-fos, and c-myc) expression in renal artery-ligated (L) animals compared to DMSO or NSsiRNA treated renal artery-ligated rats (second lane (Ligation+DMSO) and third lane (Ligation+NSsiRNA) ). GAPDH was used as internal loading control. C, a graphic representation of RT-PCR data shows down-regulation of ANF, β-MHC, c-jun, c-fos, and c-myc gene expression with S31-201 and STAT3 siRNA treatments respectively compared to ligated animals. **, p < 0.01 with respect to Sham-treated; ††, p < 0.01 and †, p < 0.05 with respect to ligated (L) or L+NSsiRNA treatment; n = 10 in each group).

