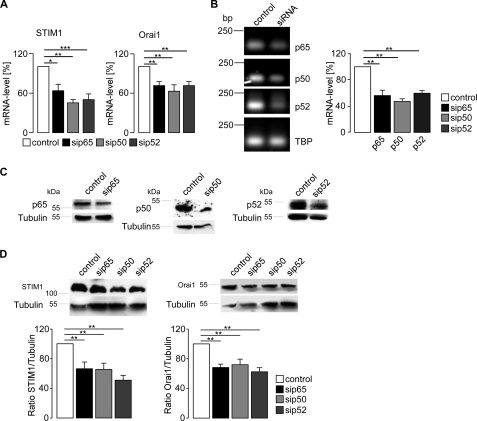
FIGURE 5.
Effect of NF-κB subunit silencing on STIM1 and Orai1 transcript levels. A, arithmetic means (±S.E., n = 4–8) of the abundance of mRNA encoding STIM1 and Orai1 in HEK293 cells without and with silencing of p65, p50, and p52. * (p < 0.05), ** (p < 0.01), and *** (p < 0.001) indicate statistically significant differences (ANOVA). B, left panel, shown is a representative agarose gel of cDNA after RT-PCR extracted from HEK293 cells silenced with siRNA for p65, p50, or p52 to control the success of knock down. TBP was used as an internal control. Right panel, arithmetic means (±S.E., n = 3–8) of the mRNA abundance encoding p65 (black bar), p50 (light gray bar), or p52 (dark gray bar) in HEK293 cells compared with cells transfected with scramble siRNA (white bar) are shown. ** (p < 0.01) indicate statistically significant differences (ANOVA). C, Western blot analysis of whole cell lysate in HEK293 cells silenced with siRNA for p65, p50, or p52 is shown. As control, scrambled siRNA was utilized. The success of knockdown of p65, p50, or p52 was tested with specific antibodies. The blot was stripped and reprobed with tubulin to control equal loading. The experiment was completed five times. D, Western blot analysis of whole cell lysate in HEK293 cells silenced with siRNA for p65, p50, or p52 is shown. Upper left panel, shown is a representative blot of STIM1. Upper right panel, shown is a representative blot of Orai1. Lower left panel, shown is the arithmetic means of STIM1/tubulin ratio (±S.E., n = 5). Lower right panel, shown is the arithmetic means of Orai1/tubulin (±S.E., n = 5). ** (p < 0.01) indicate statistically significant differences (ANOVA).

