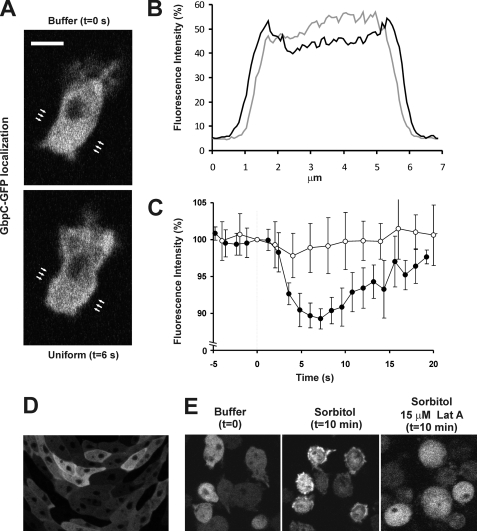
FIGURE 1.
GbpC translocates to the cell boundary and cell cortex upon cAMP-stimulation and osmotic stress and during cell streaming. Starved gbpC-null cells expressing GbpC-GFP were stimulated with 10−6 m cAMP. A, confocal images at the indicated times before and after cAMP-stimulation. B, line-scan images derived of the full image in A. Positions of scans are indicated by arrows in gray cells before and in black cells 3–6 s after stimulation. C, the decrease of the fluorescence intensity of GbpC-GFP (●) and cytosolic RFP (○) in the cytoplasm, which was analyzed using ImageJ. Data are mean ± S.D. (n = 6 cells). D, gbpC-null cells expressing GbpC-GFP were placed on non-nutrient agar plates and allowed to starve. Confocal images were taken after 6 h of aggregation. E, cells expressing GbpC-GFP were exposed to 200 mm sorbitol, and confocal pictures were taken before and after osmotic stress in the presence and absence of actin polymerization inhibitor latrunculin A.

