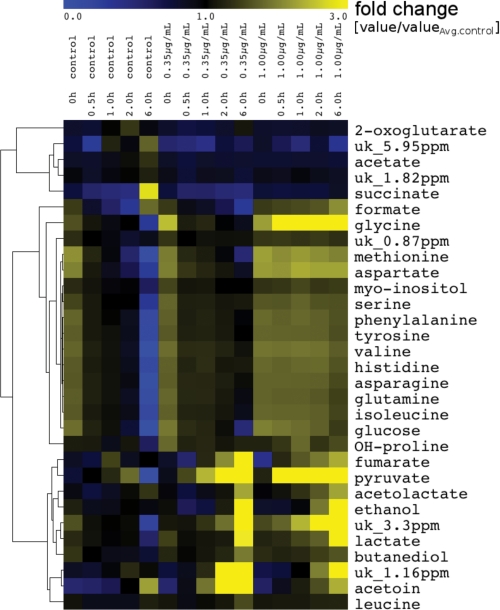
FIGURE 3.
Exometabolome changes in S. aureus cultures upon TPBC treatment. Hierarchical clustering analysis groups the 1H NMR-detected extracellular metabolite profiles over the three different growth conditions (0.0 μg/ml (control), 0.30 μg/ml, and 1.0 μg/ml TPBC) into different profile classes. Blue and yellow indicate decreases and increases, respectively, in concentration. Concentrations were set in relation to measured A578 values at a given time point. uk, unknown metabolite.

