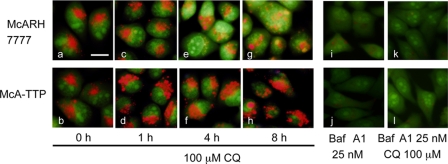
FIGURE 6.
Changes of lumenal pH in CQ-treated McARH7777 and McA-TTP cells. McARH7777 (a, c, e, g, i, and k) and McA-TTP cells (b, d, f, h, j, and l) were stained with acridine orange. Cells were treated with 100 μm CQ for 0 h (a and b), 1 h (c and d), 4 h (e and f), and 8 h (g and h). i and j show cells treated with 25 nm bafilomycin A1 (Baf A1). k and l show cells pre-treated with 25 nm bafilomycin A1 for 45 min before the addition of 100 μm CQ. Scale bar = 10 μm.

