. 2011 Oct 10;38(1):3–8. doi: 10.1037/a0025708

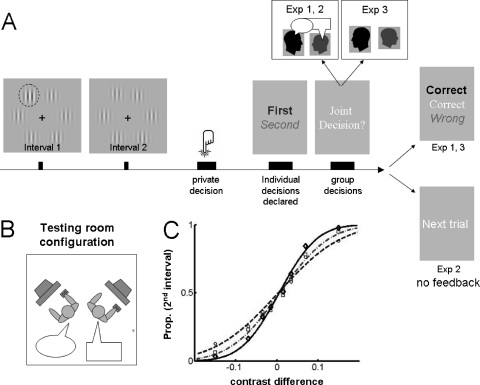
Figure 1. (A) Sequential schema of events in Experiments 1–3. Each trial started with two stimulus intervals. Visual stimuli consisted of six vertically oriented Gabor patches that were displayed equidistantly around an imaginary circle. One (randomly selected) interval contained the target (here indicated by the dashed circle) of higher contrast. Participants then indicated their individual decisions privately. If they disagreed, in Experiments 1 and 2 participants negotiated a joint decision; in Experiment 3, one (randomly assigned) participant made a joint decision on behalf of the group without any interaction. Feedback about accuracy was provided in Experiments 1 and 3 but not in Experiment 2. (B) Testing setup. (C) Group average psychometric functions relating the individual and group choice to stimulus strength in Experiment 1. The X axis shows the contrast difference at the oddball location (i.e., contrast in the second interval minus contrast in the first). The Y axis shows the proportion of trials in which the target was reported to be in the second interval. Circles: average performance of the less sensitive dyad members; squares: average performance of the more sensitive dyad members; diamonds: average performance of the dyads. The curves are the best fit to a cumulative Gaussian function.

Figure 1