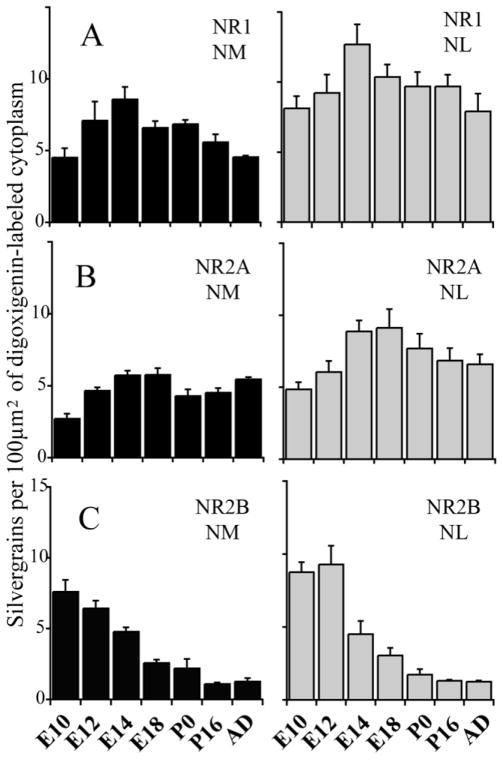
Fig. 4.
A: NR1 mRNA levels increased between E10 and E14 and then remained at relatively high levels in NL and at moderate levels in NM throughout development. B: NR2A mRNA increased in both NM and NL between E10 and E18 and remained at moderate levels in NL and NM after hatching. C: NR2B mRNA was expressed at high levels at E10 and E12, and declined between E12 and E18. Afterward, NR2B remained at low or negligible levels. Each bar is the normalized mean grain count for all labeled neurons in sections through NM or NL, pooled across animals. Error bars show standard deviations of the mean.

