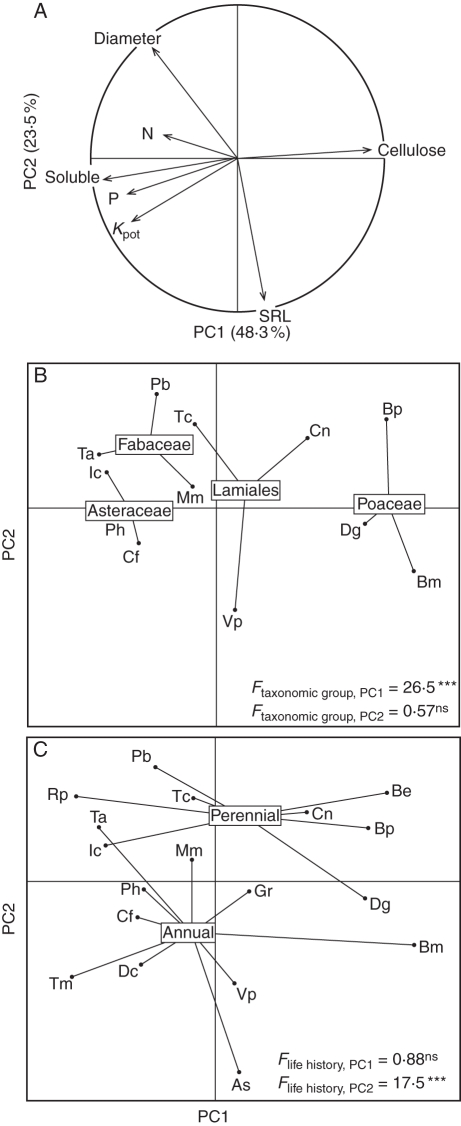
Fig. 2.
Principal component analysis of root traits and potential decomposition rates for the 18 species studied. Projection of variables (A) and species as a function of taxonomic group (B) and life history (C). Abbreviations for root traits: Kpot, root potential decomposition rate; N, nitrogen concentration; P, phosphorus concentration; Soluble, water-soluble compound concentration; Cellulose, cellulose concentration; SRL, specific root length. For species' abbreviations, see Table 1. F- and P-values from ANOVAs evaluating the effects of taxonomic group and life history on species' axis scores (PC1 and PC2) are given in (B) and (C), respectively. ***P < 0·001; ns, non-significant.

