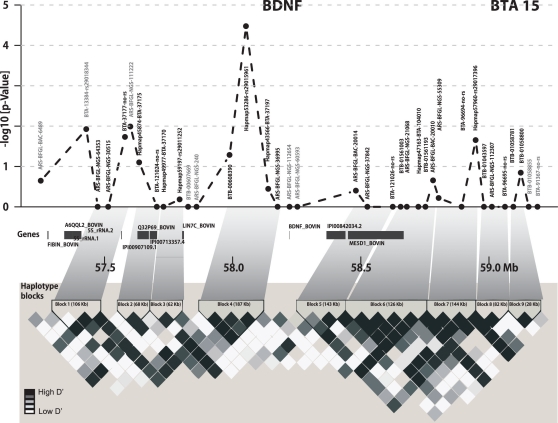
Figure 1.
Gene and haplotype block structure of the 2 Mb BDNF region and LD heat map. In the upper part negative log10 p-values for SNPs within the 2 Mb target region of BDNF are shown. All genes of the region are highlighted in dark gray. The lower part shows the pairwise D′ for the BDNF region using Haploview. Haplotype blocks are indicated with black triangles.

