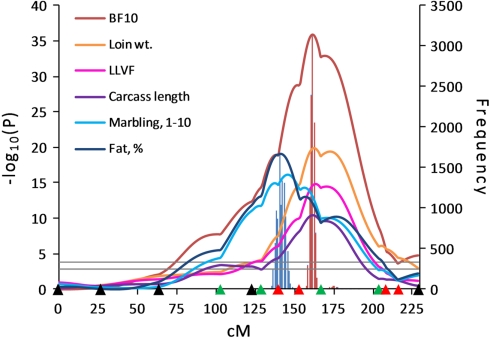
Figure 2.
Line-cross analysis indicated strong evidence for QTL influencing fat deposition traits on SSC6. Highly significant QTL for traits related to fat deposition were identified on SSC6. Confidence intervals for fat percentage and 10th-rib backfat (BF10) were estimated using 10,000 bootstrap permutations as 136–146 cM (blue bar) and 159–165 cM (red bar), respectively. Marker positions are shown as triangles on the X-axis (black, markers used for both QTL scans and genotyped only in 510 animals; green, markers used for both QTL scans and genotyped in all animals; red, markers used for second scan only and genotyped in all animals). Horizontal lines indicate significance thresholds (lower line, 5% FDR; upper line, 1% FDR).

