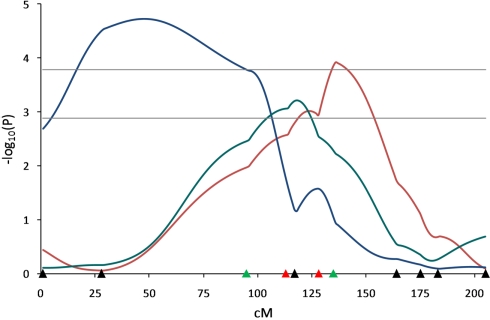
Figure 4.
Quantitative trait loci results determined by different models for pH related traits on SSC3. Line-cross model detected a QTL (q < 0.01) for 45 min pH (red line) and half-sib model detected a QTL (q < 0.01) for 45 min carcass temperature (blue line). Combined model identified a QTL (q < 0.01) affecting pH decline from 45 min to 24 h (green line). Marker positions are shown as triangles on the X-axis (black, markers used for both QTL scans and genotyped only in 510 animals; green, markers used for both QTL scans and genotyped in all animals; red, markers used for second scan only and genotyped in all animals). Horizontal lines indicate significance thresholds (lower line, 5% FDR; upper line, 1% FDR).

