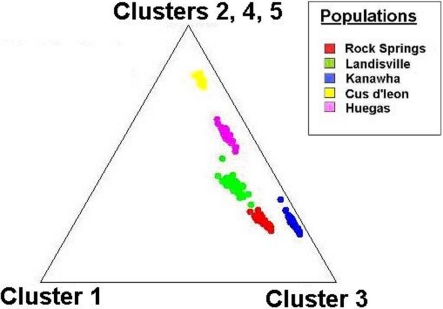
Figure 4.
Cluster analysis of the ancestry coefficient (Q) among individual SNP genotypes collected at O. nubilalis sample sites. The individual ancestry vectors on the triangle plot are representative of North American and European samples, and are derived from K = 5 components (assumed number of independent populations during analyses). Each components are displayed as the distance to the corresponding corner of the triangle, where individual genotypes at the points of the triangle are completely assigned to a single population of origin.

