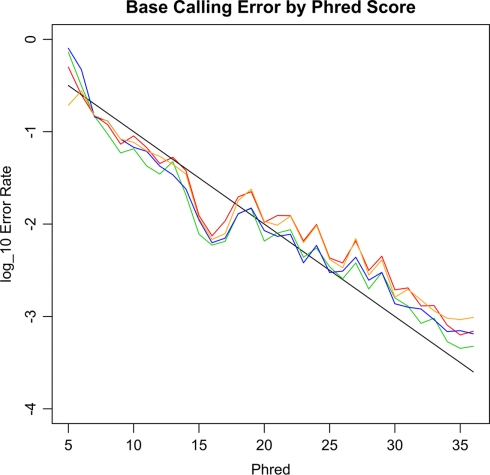
Figure 2.
The empirical base-calling error rates against Phred score. The black line is the theoretical error rate based on the Phred score, i.e., 10(−Phred/10). The red, orange and blue and green lines are for A, C, G, T bases, respectively. The A and T bases have slightly higher error rates than those of C and G.

