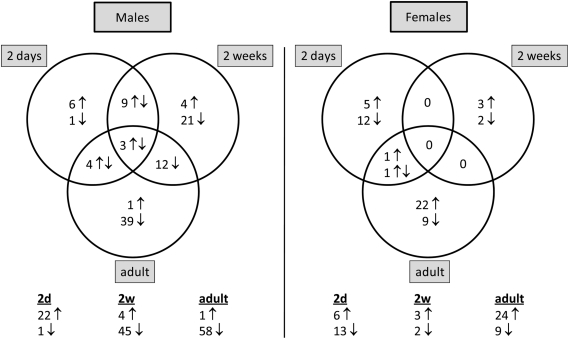
Figure 1.
Number of ribosomal protein genes that are differentially expressed by molsidomine at each age per gender. The distribution of these genes between ages per gender is shown in the Venn diagram. Below the diagram is noted the total number of ribosomal protein genes that are significantly differentially expressed in molsidomine vs. control FHH rats at each age.

