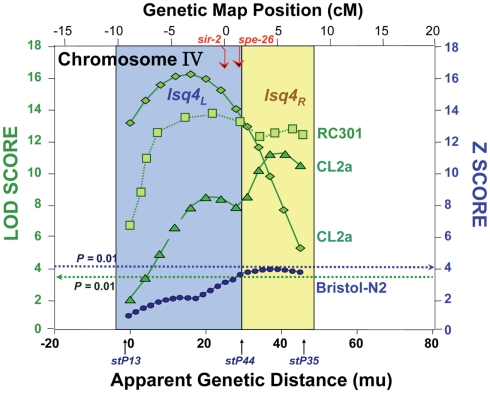
Figure 1.
Composite of multiple mappings for crosses between Bergerac-BO (a common reference strain with >500 transposon markers) and other C. elegans strains. Data are drawn from references (Ebert et al., 1993; Ayyadevara et al., 2003, 2001). The Bristol-N2 × BO cross was analyzed by non-parametric interval mapping, which produces Z scores as output (right ordinate), while the others (RC301 × BO and two independent CL2a × BO crosses) were analyzed by categorical trait interval-mapping (Ayyadevara et al., 2003), for which likelihood results are generated as LOD scores (log of odds ratio; green curves refer to the left ordinate). Note that the RC301 × BO data shown here correspond to the same cross presented previously (Ayyadevara et al., 2001), but reanalyzed by our categorical trait interval-mapping procedure (Ayyadevara et al., 2003). Dashed horizontal lines indicate empirical P = 0.01 false-positive thresholds based on 1000 interval-mappings, permuting genotype with respect to LS.

