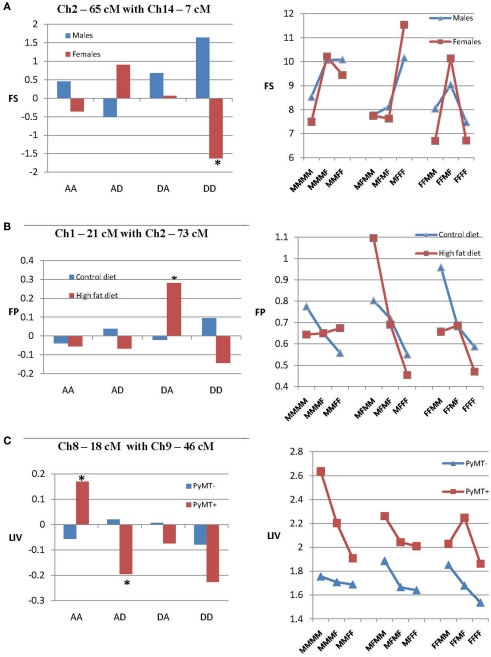
Figure 2.
Epistatic effects in the separate sexes (A), diets (B), and PyMT groups (C). Each example includes a bar diagram that shows the epistatic effects of two QTLs on the trait in each sex, diet, or PyMT group (*P < 0.05). There also is a second line diagram that shows how epistasis in each group affects the relationship among the nine genotypic values (M, gene from M16i line; F, gene from FVB line) generated from the interaction of the two QTLs. (A) Illustrates dd epistatic effects of QTLs on chromosomes 10 and 13 on 6W that are significant only in males. (B) Illustrates epistatic effects of chromosome 2 and 3 on FP that are significant only in mice fed the high-fat diet. (C) Illustrates epistatic effects of chromosomes 3 and 9 on FS that are significant only in mice with the PyMT gene.

