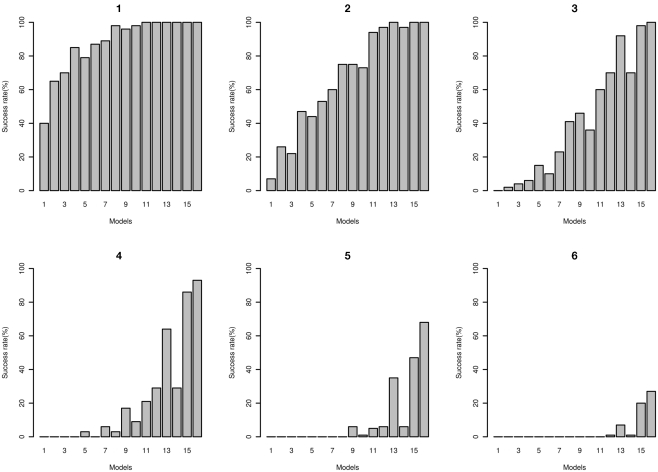
Figure 10.
Power of MDR for detecting correct disease loci. Plots: 1, 2, 3, 4, 5, and 6 show power of detecting true interacting loci using filter based on classification error rates of 45, 43, 41, 39, 37, and 35 respectively for two-locus interaction effects only models 1 through 16 (see Tables A4 and A5 in Appendix).

