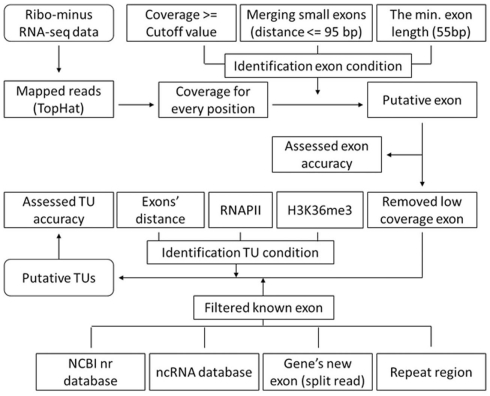
Figure A1.
A flowchart of gene identification process. We mapped the ribo-minus RNA-seq data using TopHat and created the coverage file for genome and identified exons according to the coverage of each position (>= cutoff value). Since 95% intron lengths are > or =95 bp, we merged small exons (distance < or =95 bp). Moreover, since 95% exon lengths are > or =55, we only keep the exons whose length is equal or larger than 55 bp to reduce false positives. We remove low coverage exons to reduce errors. We also filter known exons and build novel TUs on the basis of H3K36me3, RNAPII, and the different distance of adjacent exons between internal of TUs and adjacent TUs. We evaluate the accuracy of TU building by comparing our TUs with Fantom3 RNAs of intergenic regions.

