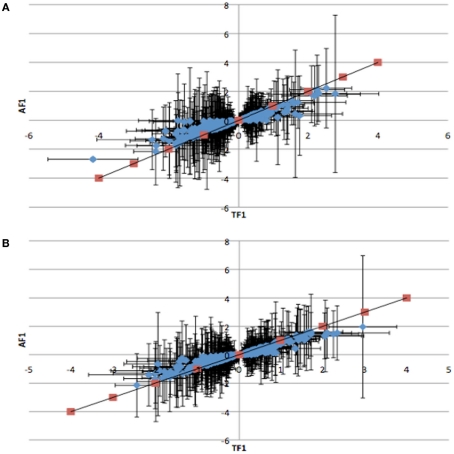
Figure 3.
Plots of the relative expression with 95% confidence intervals of TF1 against AF1 cis-by-trans interactions for (A) infected and (B) uninfected animals. Red points indicate predicted response for cis-regulatory effect where TF1 = AF1. All cis-by-trans points show lower expression in AF1 than in TF1.

