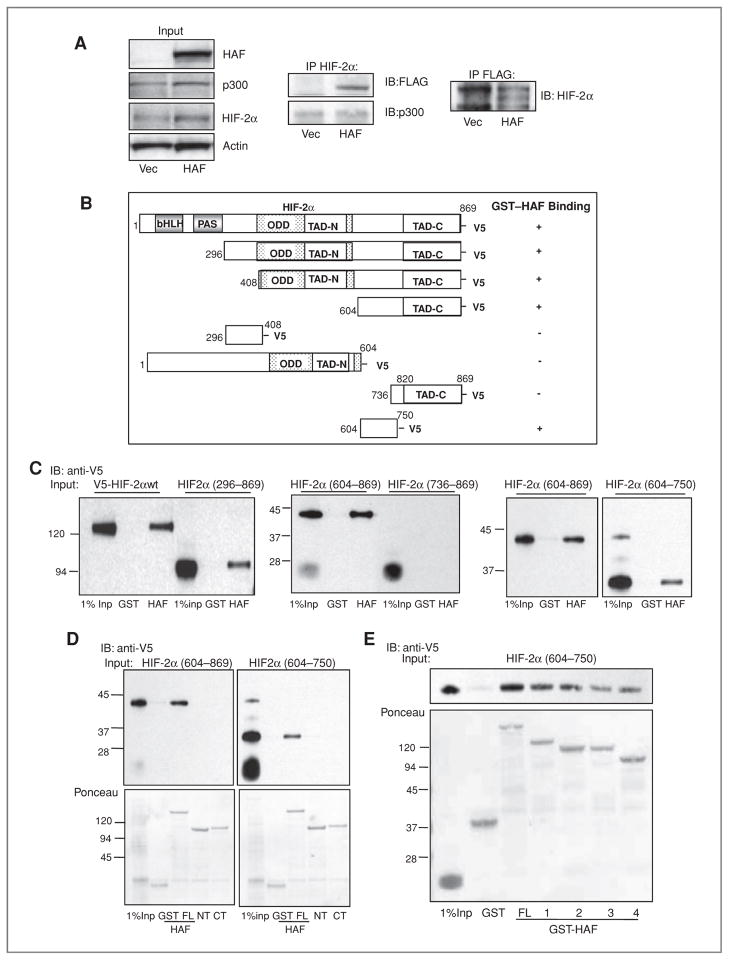
Figure 2.
Mapping of the HAF–HIF-2α interaction domains. A, Western blot showing the co-IP of FLAG-HAF with HIF-2α and vice versa in U87 cells stably overexpressing FLAG-HAF. B, schematic diagram showing HIF-2α deletion mutants used in pull down assays and their ability to bind GST-HAF as detected by Western blot. C, Western blots showing results of pull down assays depicted in B. The binding of GST-HAF to V5-HIF-2α was detected by using anti-V5 antibodies. D, Western blot showing the results of pull down assays by using GST-HAF (full length, FL), GST-HAF 1–422 (N-terminus, NT), or GST-HAF 396–800 (C-terminus, CT) and in vitro transcribed/translated V5-HIF-2α deletion mutants. E, mapping of the HAF-binding region of HIF-2α (604–750). HAF truncations: FL – full length; 1–HAF (200–600); 2–HAF (300–600); 3–HAF (200—500); 4–HAF (300–500). IB, immunoblotting.

