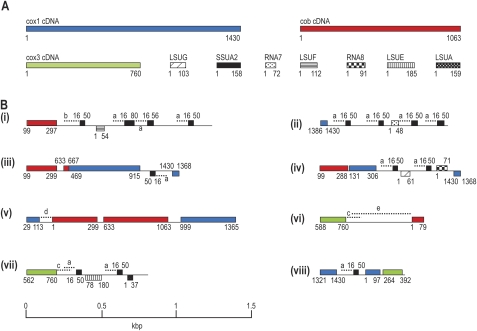
FIG. 1.—
Schematic of Hematodinium sp. cDNAs (A) and eight mtDNA fragments generated by PCR (B). Gene sequences in (A) correspond to the longest cDNA data generated for each gene. Mitochondrial sequences are drawn to scale, with coding sequence in (B) on either the forward or the reverse strand indicated above or below the line, respectively. All mtDNA fragments represent single PCR amplicons. Colored blocks indicate protein-coding genes, textured black boxes indicate rRNA genes. cDNA lengths (in nucleotides) are indicated in (A), and corresponding nucleotide matches in PCR fragments are indicated in (B). Duplicated intergenic sequences (>99% identity) between PCR fragments are indicated by dashed lines and matching lowercase letters. Some lowercase letters have corresponding matches in supplementary figure 1 (Supplementary Material online).

