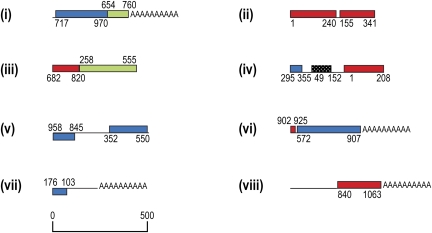
FIG. 7.—
Schematic of Hematodinium sp. polycistronic cDNAs from Hematodinium 454 data. Mitochondrial sequences represent individual 454 reads. Mitochondrial sequences are drawn to scale, with coding sequence in on either the forward or reverse strand indicated above or below the line, respectively. Colored blocks indicate protein-coding genes, textured black boxes represent rRNA genes. Gene sequence lengths are indicated in nucleotides and are relative to cDNAs in figure 1A.

