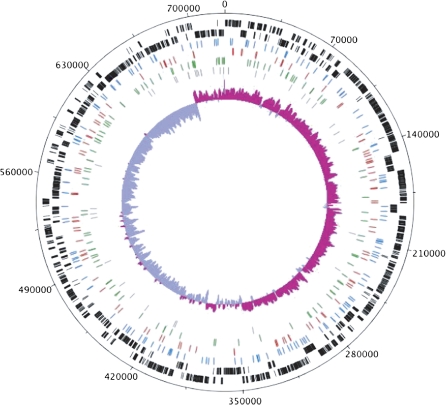
FIG. 2.—
Genome map of Blochmannia vafer. Tickmarks on the outermost circle show nucleotide positions in 35 kb increments. The two outermost tracks in black show coding sequences on the plus strand (track 1) and the minus strand (track 2). The next three tracks display positions for synonymous SNPs (blue), nonsynonymous SNPs (red), and intergenic SNPs (green). Indel positions are shown in gray. The innermost track shows GC skew calculated with window size of 1,000 bp and step size of 10 bp. Pink shading above the center line indicates GC skew values greater than the genome average, whereas purple shading below the center line indicates GC skew values less than the genome average. Position 0 on the genome map corresponds to the location of the origin of replication in Blochmannia pennsylvanicus and Escherichia coli. The figure was generated using DNAPlotter (Carver et al. 2009).

