Figure 6.
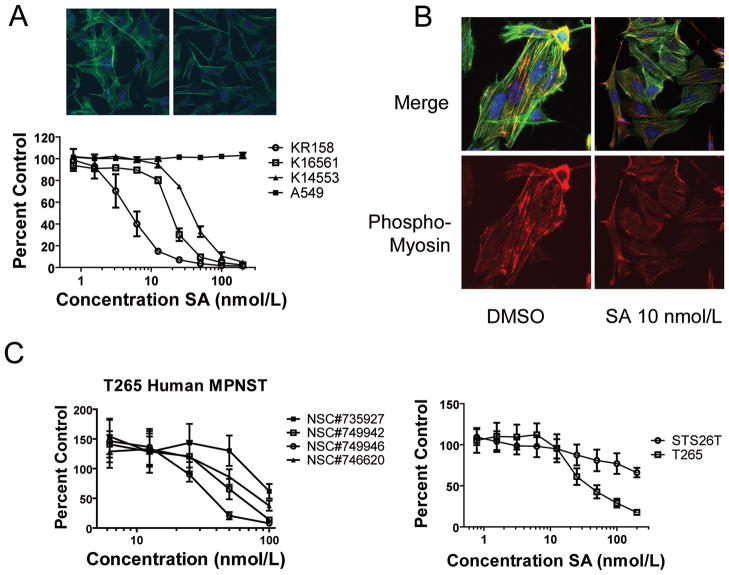
SA inhibits the growth and MLC phophorylation of human and murine NF1 deficient MPNST cell lines. A, Nf1−/−;Trp53−/− tumor lines from NPcis mice, KR158 (astrocytoma) and K16561 and K14553 (MPNST), are sensitive to inhibition by SA, compared to A549 cells, as evaluated by XTT assay plotted as a percentage of cells treated with vehicle only. Points, mean percentage growth of three wells compared to DMSO treated controls. Top images are of K14553 cells treated for 18 hrs with DMSO (left) or SA 100 nmol/L (right) and then stained with Alexa Fluor 488-phallodin (green) to visualize the actin cytoskeleton, and counterstained with DAPI (blue) to visualize the nucleus. B, K14553 cells show loss of phospho-MLC (red) in response to 18 hr treatment with SA, compared to DMSO treated cells. Cells were counter stained with Alexa Fluor 488-phallodin (green) to visualize the actin cytoskeleton, and DAPI (blue) to visualize nuclei. C, The human MPNST cell line T265 from an NF1 patient is sensitive to synthetic analogues of SA as evaluated by XTT assay (left panel), and the sporadic human MPNST cell line STS26T is resistant compared to T265 (right panel) as measured by XTT assay.

