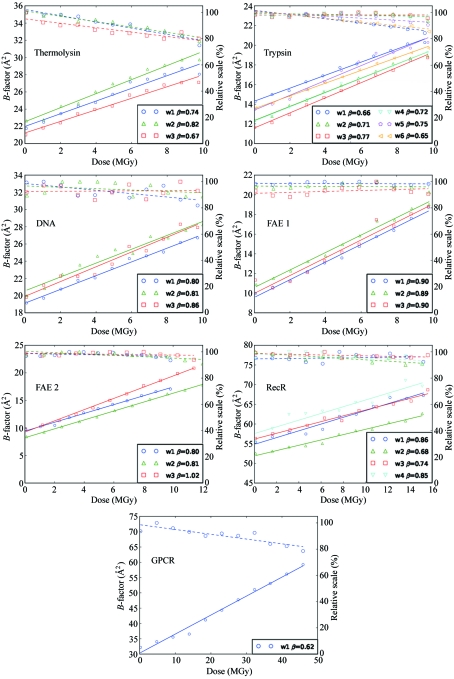
Figure 1.
Relative scales (overall scale normalized to the maximum value for all the wedges) and B-factors against nominal dose. A linear fit of the B-factors versus dose is used to calculate the decay rate (or sensitivity coefficient) β. Full lines represent B-factors and dashed lines represent relative scales.

