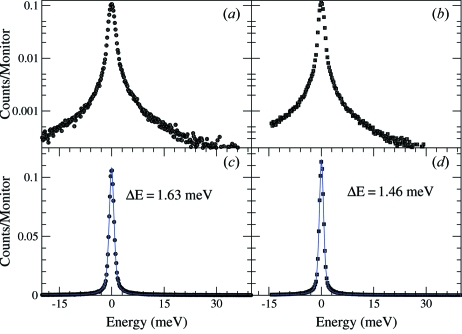
Figure 8.
Resolution function measured from two analyzers. (a) and (b) Logarithmic plots of the measured resolution functions. (c) and (d) Raw resolution and the pseudo-Voigt fits; the black symbols are the data and the blue lines are the fit. The estimated error bar in the measured resolution is about 0.1 meV.

